Category Archives: Education

On Paid Sick Leave, as with Other Policy, Universal Beats Targeted and Technocratic

Due to a new state law, California workers employed by organizations with 26 or more employees can now receive up to 10 COVID-related paid sick days on top of the paid leave they already have. This law, which follows previous supplemental COVID-related sick leave legislation at the federal and state levels, is well-intentioned and helpful.

California’s 2022 COVID-19 Supplemental Paid Sick Leave (“2022 SPSL”) law also provides a great example of why targeted, technocratic policymaking is inferior to the establishment of universal programs. I am proud to work for an organization, San José Unified School District, that is exceeding the law’s minimum requirements with a much more sensible universal additional sick leave policy.

Effective on February 19, the state’s 2022 SPSL law provides additional COVID-related sick leave in two banks:

Bank 1: 5 days are available to anyone who is unable to work for a variety of COVID-related reasons including vaccine appointments, vaccine side effects, having to care for a child whose daycare or school is closed, or the need for the individual or a family member to isolate or quarantine due to COVID exposure.

Bank 2: 5 more days are available only to people who have either tested positive for COVID or are caring for a family member who has tested positive for COVID.

The sick leave can be taken up until September 30, 2022, and people who missed time from work between January 1, 2022 and February 19 are able to submit a request to their employer to have the paid sick leave applied retroactively from either of the two banks. If an employee requests leave from Bank 2, employers can require the employee to provide documentation of positive test results. Employers can also request documentation for the use of days from Bank 1 if they have reason to believe that the “employee is not requesting 2022 COVID-19 Supplemental Paid Sick leave for a valid purpose.”

This setup is complicated for both employers and employees. Employers must track the two separate leave banks in addition to whatever other categories of leave they offer employees. Retroactive adjustments to compensation are also not the easiest to implement. When employers get a retroactive request, in addition to figuring out how to apply it in their payroll systems, they are required to add information about it onto the employee’s next itemized wage statement. Employers can choose not to require documentation for either Bank 1 or Bank 2 requests to avoid having to process extra paperwork, of course, but even if they do that, and even if you (like me) believe the benefit to employees is much more important than the cost to employers, the 2022 SPSL law creates some undeniable administrative challenges.

The new state law is also suboptimal for employees. Gathering and submitting documentation when employers do require it can be a hassle. In addition, because California’s 2021 COVID-19 Supplemental Paid Sick Leave law expired on September 30, 2021 and the retroactivity of the 2022 law only extends back to January 1, 2022, there’s a bizarre no-supplemental-sick-leave carveout only for workers who were unable to work due to a COVID-related circumstance between October 1, 2021 and December 31, 2021.

Perhaps most importantly, the rationale for the two separate banks is confusing. While they are likely in theory tied to revised public health guidance about quarantine and isolation periods, why should asymptomatic people who test positive for COVID get more sick days than people who are unable to work for the same amount of time as a result of exposure? For that matter, why should people unable to work for COVID-related reasons get an added benefit that is unavailable to people who cannot work due to the flu, cancer, or for any other legitimate health-related reason?

A universal approach, as our leadership team in San José Unified recognized, addresses all of these issues. Instead of providing two new separate sick leave banks between now and September 30, 2022 and allowing partial retroactivity back to January 1, San José Unified added ten days of regular sick leave for all employees moving forward. San José Unified will pay employees at their daily pay rate for any of the additional days that have not been used by September 30, 2022. There’s no additional paperwork, no additional tracking or leave categories, no need to worry about retroactive adjustments, and no arbitrary lines drawn about who deserves sick days and who doesn’t – there’s just a straightforward, more generous benefit for San José Unified employees that San José Unified management can easily implement.

Many employers – particularly those in the private sector – unfortunately oppose worker benefits in general. They may not factor fairness or the needs of their employees into their decision-making when implementing the 2022 SPSL law. While there’s still a good rationale for employers to factor in the efficiency savings of a universal approach, many may not judge those efficiency savings to be worth the greater cost of providing a larger benefit to more people.

Public entities, however, should avoid counterproductive penny pinching and design policy to provide more consistent benefits, enhance administrative efficiency, and reduce confusion. We do it in San José Unified and other, larger governmental entities can do it, too.

2 Comments

Filed under Business, Education, Labor

Resident Perspective: It Begins

This is the continuation of a series of journal entries depicting what it’s like to be a part of the COVID pandemic from the medicine resident perspective.

Wednesday, March 25th

Today was my first day of quarantine and now I feel like I’m a part of society. In the prior weeks, working on the general hospital floor I was constrained by daily ritual –nothing said on the news or by the government about isolating or “staying home” applied to healthcare workers, or residents, more specifically. Those working in hospitals are in the thick of it, but we have a completely different experience because we have to continue to go to work and do our jobs while everyone else has just had drastic changes dictated for their daily lives. I was working long hours every day so I didn’t observe any special social distancing; my daily routine recently had been to come home and only have about an hour before turning in for the night so I wasn’t doing much socializing. Now home and quarantined, I found out quickly how fast things could change as I spend most of the day sequestered in our bedroom away from my family and where they typically are during the day.

My wife’s mother watches our son but we’ve collectively decided that while I might feel fine, because of my high risk exposures it would just be best for her to not come until things cool off. We’re lucky that we have the opportunity to actually have this option as many families in our situation would either have to choose exposing a loved one to potential coronavirus or have the parent take time from work to watch their kid. I fully appreciate we’re privileged enough to even have that possibility.

I look out my closed bedroom window and think it’s a shame that the weather’s so nice as I’m sure everyone is itching to be outside. Spring is in full swing even on our street, as the trees are approaching full bloom, and I’m pretty sure a bird’s nest is being built in our gutter as I hear constant chirping with rustling of leaves and tin behind the upper corner of my bedroom. I can hear neighborhood kids outside playing. I look down and see groups of 4 or 5 parents awkwardly try to stay 6 feet apart on our narrow street. I’d like to kindly remind them to keep their distance, but like Jimmy Stewart in Rear Window, I just gaze at them from the safety of my newly shuttered life.

Hearing the kids play, I wondered, what are they thinking is going on? How much have their parents told them? I don’t know what age you go from being elated you’re off from school to being worried about whether or not you and your family will survive. Do they think this is a normal occurrence and something they’ll have to deal with frequently in their lives? This must have a major impact in many different ways on kids of varying ages. I remember getting talks at school about fire safety and going home every night and practicing an escape plan with my family because I was so terrified. I don’t know what 8 year old me would be feeling about the invisible yet much more real confrontation with a virus. I couldn’t imagine having a 2 or 3-year-old that doesn’t understand that they can’t go outside to play with friends and then have to keep them entertained throughout the day. Then do it again the following day indefinitely.

I’m now realizing there will be so many unforeseen consequences, namely impacting those on the lower socioeconomic scale. When you work in healthcare during a crisis all you care about is how it impacts you and your patients. When suddenly removed, I’m forced to take a step back and come to grips with how this affects literally everything and everyone else in society. Maybe it’s because I now have my own child to look out for, but children have been on the forefront of my thoughts related to the pandemic. They may not be medically the most vulnerable in this case but they are in terms of long-lasting impact. Every facet of their lives are being disrupted—psychologically, educationally, nutritionally, and overall developmentally. Many families rely on food provided for kids at school. Expansion of SNAP benefits under Families First Coronavirus Response Act, which recently passed, may lead to unhealthier food choices for children as well, as this isn’t regulated like nutrition guidelines for school lunches. I’d also have to assume that kids aren’t getting the same quality of education if it’s all strictly remote, let alone the meaningful and necessary bonding that takes place at school. No doubt there will be a wealth of data to supply research to tell us what we intuitively know, which is when society stops functioning as usual the most vulnerable among us are impacted the greatest.

This time away from the hospital is allowing me to reflect on the many facets of life that are touched by this pandemic, so I’ll treat it like sabbatical.

Leave a comment

Filed under Coronavirus, Education, Food, Health Care and Medicine, Pandemic, Poverty and the Justice System, Residency

On Both Politics and Policy, “For All” Beats “For Some”

Medicare for All or Medicare for All Who Want It? Free college for all or free college for just the non-rich? The debate between universal (available to everyone) and means-tested (available only to those who meet certain criteria) programs has defined the Democratic primary. Bernie Sanders, often joined by Elizabeth Warren, argues for universalism, declaring education and health care to be basic human rights. Amy Klobuchar, Pete Buttigieg, and Joe Biden argue against, contending that government resources must be targeted only to those in need, rather than wasted on the rich and/or on those who ostensibly don’t want them.

On the most commonly cited rationale for each position – sustainability for universalists and resource constraints for means testers – proponents of universalism have the upper hand. Medicare and Social Security, two of the United States’s largest, most successful, and most popular programs, are as close to universal as we’ve got. By giving everyone a stake in these programs, proponents argue, their near-universality has insulated them from attack. Bob Greenstein (the President of the Center on Budget and Policy Priorities, where I used to work) points out both that these programs have been cut and that their popularity could conceivably be due to the perception that they’re tied to work rather than to their quasi-universal nature, but the Alaska Permanent Fund, a state-level universal program not tied to work, also enjoys overwhelming public support. So do universal programs that aren’t tied to work in other countries – other countries’ universal health care systems, for instance, are way more popular than our means-tested approach. It’s reasonable to expect a universal program to be more sustainable than a means-tested alternative over time.

The Buttigieges of the world counter that universal programs are too expensive; in December, for instance, Buttigieg said they would require “the kind of taxation that economists tell us could hurt the economy.” But even if you reject the notion that government spending can be substantially increased without raising taxes, concerns about higher taxes are entirely without merit. Research has consistently (and predictably) failed to support such concerns, the United States has significantly lower taxes than the rest of the developed world, and scores of reputable economists support tax proposals, like those Sanders and Warren have released, that can fund the universal programs on offer. When Buttigieg says he’d prefer to “save those dollars [that would otherwise be spent on free college] for something else,” he is presenting a false choice. It is only his and others’ political preferences, not actual resource constraints, that stand between us and full funding of all the priorities he listed: education, infrastructure, child care, housing, and health care.

Still, the most compelling case for universal programs isn’t political. It is, ironically, that they’re better at achieving two of means testing’s major goals: helping people in need and doing so efficiently. They reduce stigma, arbitrariness, usage barriers, and administrative costs.

Universal programs help people in need by reducing stigma

Most low-income people work incredibly hard to put roofs over their heads and food on their tables. Yet they’re constantly accused of being unskilled, lazy, good-for-nothing loafers in search of government handouts. Afraid of being perceived that way and/or ashamed of their economic situation, many people who are struggling to get by decide not to access the means-tested benefits to which they’re entitled. They’d rather go hungry than risk someone catching them using food stamps in the checkout line.

Correcting false stereotypes is a top priority, with universal programs a useful complement for improving the experience of people in need. If everyone received SNAP benefits (SNAP, which stands for Supplemental Nutrition Assistance Program, is the contemporary name for the food stamp program), for example, using them would no longer identify someone as low-income. We would thus expect higher rates of SNAP usage among low-income people.

That’s exactly what we’ve seen with the school meals program following the introduction of a program called “community eligibility,” which enables schools and school districts with a certain percentage of low-income students to offer free school meals to all students – regardless of their income levels – free of charge. Research suggests that reduced stigma is at least part of the reason students at schools that have adopted this program are more likely to take advantage of school breakfast and lunch programs.

Universal programs help people in need by eliminating arbitrary cutoffs

For SNAP, the income eligibility threshold is 130% of the poverty line, or about $27,700 annually for a family of three. People who make less than that amount (provided they meet other requirements – SNAP also has an asset test and restrictive eligibility rules for various groups of people including immigrants, individuals aged 18 to 49 who don’t have children, and students) can access benefits; people who make more than that amount cannot. Under Buttigieg’s higher education plan, college is free only for families making less than $100,000 a year (and discounted for families making between $100,000 and $150,000).

Means-tested benefits typically phase out slowly – that is, benefits get gradually smaller as beneficiary income gets higher – to ensure that the sum of pay plus benefits continues to increase when people pass eligibility thresholds. But why shouldn’t a family of three making $30,000 a year get food assistance? Why should $100,001 be the level at which a family starts having to pay for college? Eligibility thresholds in means-tested programs are arbitrary and inevitably create strange, difficult-to-justify divides between people right above and right below them. Universal programs avoid this problem completely by providing the same benefit to everyone.

Universal programs help people in need by reducing usage barriers

Means testing requires some form of testing, as the name implies, to determine whether or not someone is eligible for benefits. Depending on the complexity of a program’s eligibility rules, that testing might require a form of identification, proof of residence, proof of income, or any number of other things. Eligible beneficiaries may need to mail, hand-deliver, or electronically submit one or more forms, which, as Sanders accurately observed during the December debate, “people are sick and tired of filling out.

Filling out forms and proving eligibility is much more than an annoyance for many eligible people in need. Some may not know how to read or write. Some may move and/or change jobs frequently. Some may lack an official ID. The more hoops people have to jump through to access benefits, the fewer eligible people will actually end up receiving benefits.

Government agencies can mitigate this problem with outreach efforts and assistance programs, of course. But even well-administered means-tested programs like SNAP that continue to improve in these areas don’t catch everyone they should, in part because of the access barriers means testing inherently creates – in 2016, the most recent year for which we have data, about 15% of people eligible for SNAP did not participate in the program.

Universal programs improve efficiency by reducing administrative costs

In addition to creating an obstacle for eligible beneficiaries, the complexity introduced by means testing presents a challenge for efficient government. Every form that needs to be filled out has to be processed. Eligibility has to be verified. Complex rules have to be actively managed. Means-tested programs spend a larger share of their money on administrative overhead than universal programs do.

Administrative costs for Social Security, for example, are only 0.7% of total expenses. For SNAP, one of the most efficient and effective means-tested government programs, administrative spending comprises 7.7% of its total budget. Over three-quarters of those administrative costs are “certification-related,” meaning they’re “associated with determining household eligibility.”

To be clear, the overall cost of SNAP and other means-tested programs would be many times higher, even with substantially reduced overhead costs, if they were more universal. Increased overall cost is the only real potential downside of universality. And if one were forced to choose between increasing benefits for people in need and extending benefits to higher-income people who don’t currently receive them, increasing benefits for people in need would be the clearly correct choice.

But as noted above, that choice is a false one. There is no question that the US government has the money to offer increased benefits through universal programs. The only question is whether we will choose to spend it on the worthy goals of helping people in need and improving government efficiency for everyone.

2 Comments

Filed under 2020 Election, Education, Health Care and Medicine, Poverty and the Justice System, US Political System

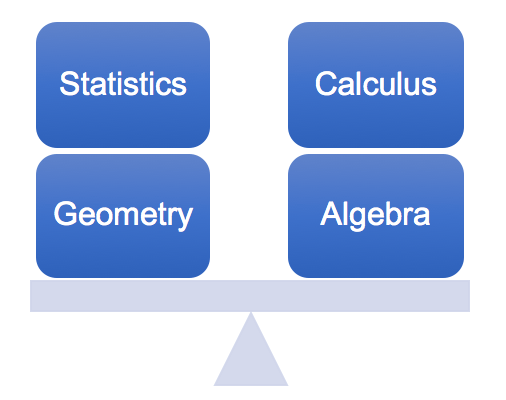
Improving the Structure of Math Departments

At many schools I’ve worked at or observed, math departments are structured counterproductively.  The best teachers often teach the most advanced classes, while the newest teachers, or those most in need of support, teach the classes that struggling students are more likely to attend.  As a result, the students most in need of excellent teaching can be least likely to get it.

Math departments may be structured this way for a variety of reasons.  There is surely a correlation of some sort between teaching skill and mastery of mathematics, so the best teachers may just more often than novice teachers be well-equipped to teach advanced courses.  It may also be the case that teachers prefer teaching advanced classes; as the students in advanced classes typically already want to be there, teachers of those classes can focus more on content instruction and less on classroom management.  School leaders may want to keep their best teachers happy, and giving those teachers the advanced classes may be one way to do that.

I can understand why teachers might, if given the choice, decide to teach AP Calculus AB instead of an intervention class geared towards students who failed Algebra I.  Especially given the workloads American society foists upon teachers, who never have enough hours in the day to do a fraction of what they’d ideally do for their students, teacher burnout is a real concern.  While I know some great teachers who love teaching hard-to-reach students and have made doing so their life’s work, and while teaching advanced students also carries its challenges, working with the highest-need students is often emotionally exhausting and probably accelerates the burning-out process.

Several approaches could potentially help reduce the tension between pursuing the most equitable arrangement – in which the best teachers teach the students who need help most – and protecting teachers against burnout.  One option would be to reduce the number of classes teachers of introductory or remedial courses would be required to teach.  If nothing else, an extra free period would give these teachers more time to plan remediation and give students constructive feedback.  Another option would be to ensure that an instructional aide is available to assist teachers in every lower-level course they teach.  A third approach would be to require every teacher teaching an AP or honors course to teach a lower-level course as well.  (None of these ideas is mutually exclusive, of course.)

Reducing teacher burnout and making our schools more equitable are big challenges that ultimately require substantially increased investments in public education, particularly in low-income areas, as well as an overhaul of what teacher workdays and support structures look like.  We must push for those investments and overhauls, not to mention the larger, outside-of-school changes that are most important for ensuring equal opportunity for every student in this country.  In the meantime, we should explore creative ways to simultaneously keep our best teachers invigorated and make sure they’re in front of our students in need.

5 Comments

Filed under Education

Teacher Satisfaction: Education’s Failure to Retain Quality Educators

Jesse Soza, Ed.D., was a classroom teacher for twelve years but chose to leave after experiencing high levels of frustration and burnout. He now researches and consults with schools and districts about teacher satisfaction, which, as he describes in this post, is intimately related to working conditions for educators.

soza

Jesse Soza

A Conceptual Misunderstanding of Teacher Satisfaction

As the 2016 – 2017 school year gets under way, one of the goals many school districts will undoubtedly have will be the retention of quality teachers. While the objective of keeping talented and skilled employees would (and should) be a best practice of any self-respecting organization, education in particular has had a difficult time succeeding in this arena. With a standing attrition rate hovering around forty percent for teachers in the first five years of service, losing high numbers of educators has become a norm for the American system. Furthermore, as a result of an almost fatalistic acceptance of this norm, a dangerous notion has emerged that teaching can be approached as a “transient profession,” implying that sustained commitment to students, colleagues and the work itself is an unnecessary trait for teachers. As high turnover rates limit teacher quality and incur high monetary costs for districts, there is little doubt that this combination is devastating for education. Districts and schools are desperate to do whatever they can to keep quality teachers.

It is not surprising, then, that there is a lot of conversation around the idea of teacher satisfaction. Districts know that happy teachers are far more likely to remain teaching than those who are experiencing dissatisfaction. Thus, significant time, effort and expenses have been marshaled in an attempt to provide incentives that might lure teachers to the profession and, more importantly, keep them teaching. Example incentives include signing bonuses, financially supplemented graduate degrees earned during the first years of teaching and/or job security in the form of extremely quick tenure (this is merely the tip of the iceberg in terms of what districts may be willing to offer). On the surface, these common-practice incentives appear desirable. One could reasonably assume that a teacher who is able to attain them should have a noticeable increase in satisfaction and thus be more likely to stay committed to teaching.

Yet data seems clear that these and other incentives have not had the desired effect of increasing retention. No matter what teachers are being offered, overall levels of satisfaction have failed to increase and the result has been a continual hemorrhaging of young, talented teachers (not to mention the high levels of burnout experienced by veteran teachers).

After studying teacher burnout and attrition and interviewing teachers across numerous sites and systems about their feelings around what it means to be an educator in the current system, I have come to an important conclusion about teacher satisfaction: What satisfaction actually is and how it is generated is not well understood within the educational community. As long as satisfaction remains ambiguous or ethereal, attempts at building and implementing meaningful action to address satisfaction will continue to be ineffective. Therefore, the primary issue at hand becomes turning the nebulous concept of teacher satisfaction into something more accessible, and thus workable, for those who seek to engage it.

Defining Satisfaction

What makes satisfaction such an interesting phenomenon is that, while people experience it in a variety of situations on a daily basis, they often encounter difficulty in placing precise parameters around what exactly is going on. The overall concept, however, is fairly simple: Satisfaction is the resultant feeling that occurs when an internal desire or expectation is either fulfilled or denied (to a degree) by conditions of reality; the more fully reality fulfills an expectation, the greater the satisfaction one feels. When reality denies actualization of an internal expectation, dissatisfaction occurs. Levels of satisfaction are thus constantly generated as desires or expectations interplay with people’s experiences. However, what makes satisfaction difficult to analyze and measure is the sheer number of variables that influence it. Indeed, the devil is in the details. In the case of education, understanding teacher satisfaction requires insight into how the desires and expectations of teachers are interplaying with the conditions that make up their work environment.

The Desire to “Make a Difference” Versus the Reality of Teacher Work Environments

The vast majority of teachers enter the profession with the intent of “making a difference” in students’ social, emotional and academic lives. While the specific details of how that is carried out will vary from teacher to teacher, the expectation and desire to “make a difference” assuredly sits at the core of teachers’ passion and drive. Teacher satisfaction, then, must be considered a measure of how well a teacher is able to actualize those expectations and desires. The more they are allowed to work towards “making a difference,” the more likely teachers are to find satisfaction. However, if they perceive that they are unable to do so, dissatisfaction is likely to set in.

Unfortunately, teachers all too often find their expectations and desires of “making a difference” at odds with the current conditions of teacher work environments. These environments, heavily influenced by well-intentioned but deeply flawed reforms such as No Child Left Behind and Race to the Top, emphasize prescription and rigidity to meet metrics, requiring teachers to adopt pedagogy, methods and values that are not their own. Teacher autonomy, creativity and expertise (qualities normally attributed to professionals) have been sacrificed for formulaic, teacher-proof methods that mandate curriculum, instructional delivery systems and behavior management procedures, among other things. Reform meant to improve the system has actually created an educational culture that actively works to deskill teaching, although few would describe it as such. The institution defined by teachers carrying out the act of teaching is, in fact, becoming increasingly adept at stripping its workforce of its ability to do so. Fueled by what often seems like distrust and a lack of respect for teachers and their craft, various forces within society continue to deny teachers the ability to practice their vocation and, as a result, the opportunity to fulfill the expectations and desires that constitute their passion, drive and expertise.

When working conditions strip from teachers the ability to actualize the expectations that make up their passion and drive, they become alienated from the job and, because of the personal nature of teaching, themselves. Combined with teaching’s abysmal compensation and poor social status, it should not be difficult to imagine why attrition and burnout rates remain high (and will continue to be so in the future). Instead of honoring teachers as passionate, driven experts, the current trend is to view them as high-level technicians, merely carrying out dictums that have been passed down to them. The more teachers are forced to adopt the educational values, purpose, methods and strategies set forth by others, the more separated they become from their own values, purpose, methods and strategies.

This cultural invasion within education marginalizes teachers and undermines opportunities for them to find satisfaction. In a somewhat ironic twist, the passion and drive that keeps teachers in the classroom in spite of poor compensation, long hours, lack of resources, etc. is the same passion and drive that education is actively stripping from them. Without this passion and drive, there is no reason for an individual to commit to such a maligned profession, which explains the problems our system is experiencing today.

When writing about workers laboring in conditions where they cannot find meaning and purpose, Karl Marx noted, “[the worker] does not fulfil [sic] himself in his work but denies himself, has a feeling of misery rather than well-being, does not develop freely his mental and physical energies but is physically exhausted and mentally debased.” This, unfortunately, accurately describes the current state of the American educational system and its relationship with its teachers. Education, as a human endeavor, cannot continue to operate in a way that dehumanizes those who work within it. Indeed, teacher satisfaction will only be realized in systems where teachers’ expectations, desires, passion and expertise are truly respected and honored.

2 Comments

Filed under Education

Education Matters, But Direct Anti-Poverty and Inequality-Reduction Efforts Matter More

I once began a K-12 education talk by putting the following two questions on a screen.

1. What is the single policy change that would most improve the quality of K-12 education?
2. What is the single policy change that would most reduce the opportunity gap between low-income and high-income students?

I asked audience members to, by a show of hands, indicate which question spoke to them more.  They had three choices:

A) Question 1
B) Question 2
C) Doesn’t matter, since both question 1 and question 2 have the same answer

Stop and think for a second about which choice would have prompted you to raise your hand.

If you would have selected choice C, you would have been joined by about 90 percent of the audience at my talk.  I expected that result.  In a culture in which politicians routinely say things like “education is the closest thing to magic we have here in America” and cite low graduation rates in low-income areas as evidence of our education system’s failures, that view is unsurprising.

It’s also completely wrong.  The overwhelming evidence that choice C is incorrect falls into at least five primary buckets:

1) There are large gaps in test score performance in the United States before students enter kindergarten. The graph shown below, from the Economic Policy Institute, documents the extent of these gaps (there are gaps in various cognitive and noncognitive skills as well), and as Sean Reardon has shown, there is evidence that they close during the school year, only to reopen during the summer months.  The gaps have declined in size since the late 1990s, but they are, in Reardon’s words, “still huge.”

EPI Kindergarten.png

Inequitable access to preschool for low-income students is definitely part of the problem here, but gaps are apparent in infancy and probably due mostly to differences in housing, nutrition, medical care, exposure to environmental hazards, stress, and various other factors.

2) Decades of research into the causes of the gap in test scores between low-income and high-income students in the United States has consistently found a limited contribution from school-based factors. In the US, variations in school quality seem to explain no more than 33% of the discrepancies in test score performance; this number, which has been around since 1966, considers the influence of a student’s classmates to be a school-based factor (it arguably isn’t) and thus seems to be a conservative upper bound. Most studies put the school-based contribution to what is commonly called the “achievement gap” closer to 20%, with about 60% attributable to “student and family background characteristics [which] likely pertain to income/poverty” and the other 20% unexplained.

3) Economic success in this country is less common for low-income students who are successful in school than for high-income students who are unsuccessful in school. The graph below, made using data from the Pew Economic Mobility Project, compares the distribution of adult economic outcomes for children born into different quintiles of the income distribution with different levels of educational attainment.  If education were the prime determinant of opportunity, we’d expect educational attainment to determine these adult economic outcomes.  Yet the data show that children born into the top twenty percent who fail to graduate college typically fare better economically than children born into the bottom twenty percent who earn their college degrees.  In fact, the born-into-privilege non-graduates are 2.5 times as likely to end up in the top twenty percent as adults as are the born-poor college graduates.

Mobility - Pew

4) The test scores of students in the United States relative to the test scores of students around the world aren’t all that different than what students’ self-reports of their socioeconomic status would predict. The Programme for International Student Assessment (PISA) has an “index of economic, social, and cultural status” which incorporates family wealth, parents’ educational attainment, and more.  There is a gap in test score performance between students who score high on this index and students who score relatively low on it in every country in the world.  The size of the gap varies by country, as does the median test score, but there is a strong correlation overall between students’ socioeconomic status and their performance on standardized tests.  The first graph below, in which each data point relates the average socioeconomic index score for a decile of a particular OECD country’s students to that decile’s average performance on PISA’s math test, depicts this relationship.

OECD Test Scores - All.png

As the next two graphs show, test score performance for the bottom socioeconomic decile in the United States falls right on the OECD bottom-decile trend line, and while U.S. test scores for the second decile are a little below the OECD trend (as are U.S. scores for the next few deciles), socioeconomic status seems to explain American students’ performance on international tests pretty well overall.

OECD Test Scores - Bottom Decile.png

OECD Test Scores - Second Decile.png

5) The distribution of educational attainment in the United States has improved significantly over the past twenty-five years without significantly improving students’ eventual economic outcomes. While people with more education tend to have lower poverty rates than people with less education, giving people more education neither creates quality jobs nor eliminates bad ones, as Matt Bruenig has explained.  A more educated population (see the first graph below), therefore, just tends to shift the education levels required by certain jobs upwards: jobs that used to require only a high school degree might now require a college degree, for example.  The “cruel game of musical chairs in the U.S. labor market” (as Marshall Steinbaum and Austin Clemens have called it) that results is likely part of why poverty rates at every level of educational attainment increased between 1991 and 2014, as shown in the second graph below.

Bruenig1.png

Source: Matt Bruenig

Bruenig2.png

Source: Matt Bruenig

Bruenig’s analysis lacks a counterfactual – the overall poverty rate may well have increased if educational attainment hadn’t improved, rather than staying constant – but it’s a clear illustration of the problem with primarily education-focused anti-poverty initiatives.

None of this evidence changes the fact that education is very important.  It just underscores that direct efforts to reduce poverty and inequality – efforts that put more money in the pockets of low-income people and provide them with important benefits like health care – are most important if our goal is to boost opportunities for low-income students.

8 Comments

Filed under Education, Labor, Poverty and the Justice System

Friedrichs and Bain Explained

California public school teachers working in traditional school districts are by default members of their local teachers associations, which may be affiliates of either the California Teachers Association (CTA), which is the state branch of the National Education Association (NEA), or the California Federation of Teachers (CFT), the state branch of the American Federation of Teachers (AFT).  While teachers unions, like all other organizations, certainly aren’t perfect, they fulfill several roles that benefit students and teachers alike and are important, powerful advocates for low- and middle-income populations in general.

Despite these facts (or, perhaps, because of them), teachers unions have been under attack for quite some time.  And the anti-labor movement, fueled by wealthy individuals and groups like the American Legislative Exchange Council (ALEC), has been alarmingly successful.  Union membership reached a historic low of 11.1 percent in 2014 (6.6 percent in the private sector and 35.7 percent in the public sector), 25 states have adopted inappropriately-named “Right to Work” laws that deprive workers of bargaining power, and an inaccurate, misleading anti-union narrative has permeated public discourse.

Unions won a major victory in California in 2012 when we (I was a CTA Election Campaign Lead at the time) beat back Proposition 32, but the news has been less stellar since, particularly for teachers unions.  In 2014, Judge Rolf Treu sided in favor of the plaintiffs in Vergara v. California, a misleading lawsuit that attacked various aspects of teacher employment law.  Though the weakness of both the plaintiffs’ argument and the decision suggests that the case may be overturned on appeal, it still represents a dangerous threat to important employee protections that could reverberate beyond education.  Two more recent California cases, Friedrichs v. California Teachers Association and Bain v. California Teachers Association, present related dangers for labor more generally, especially because the Supreme Court will hear oral arguments in Friedrichs early next year.

As was the case with Vergara, there’s a lot of misinformation floating around about both Friedrichs and Bain.  The discussion below thus sets the record straight on how teachers-union dues and spending work in California, explains the basic arguments of both Friedrichs and Bain, debunks myths the plaintiffs have propagated, and explains why courts should rule against the plaintiffs in both cases.

How Teachers-Union Dues and Spending Work in California

Spending by teachers unions falls into two legal categories: it is either “chargeable” – that is, pertaining to collective bargaining and classified as nonpolitical – or “nonchargeable,” or classified as political.  Public school teachers in CTA-affiliated schools have three options when it comes to paying union dues:

1) If a teacher takes no action, he or she pays for both the chargeable and nonchargeable portion of CTA spending. Whether or not a teacher pays dues to their local association for nonchargeable spending may vary from local to local.

2) If a teacher marks a box on his or her membership form (shown below), that teacher can choose not to contribute towards CTA’s political activities. The teacher must still pay the nonchargeable portion of his or her dues, but that money remains in CTA’s general fund and can be used only for chargeable activities.  A teacher selecting this option remains a full-fledged member of the union.

Teachers who do not want to contribute to CTA’s political activities can check a box on a one-page form to opt out.

Teachers who do not want to contribute to CTA’s political activities can check a box on a one-page form to opt out.

3) A teacher can affirmatively opt out of paying the nonchargeable portion of his or her dues altogether. This decision must be made each year for which a teacher wishes to opt out.  A teacher who exercises this option and pays lower dues is considered an “agency fee payer.”  Agency fee payers are still represented by the union in collective bargaining and labor disputes, but they lose some advantages associated with union membership, the most significant one being the right to vote in union elections.

Each year, CTA must determine the portion of its spending that falls into the chargeable and nonchargeable categories.  It is required by law to send a “Hudson notice” showing the breakdown and the amount of the agency fee to any teacher who has chosen option 3 in a previous year.  Teachers receiving the Hudson notice also receive a letter explaining that they have at least thirty days to decide whether to opt out of the nonchargeable portion of dues again in the coming year (which they can do either by filling out a simple one-page form, shown below, or by writing a letter).

Teachers who want a rebate for the political portion of their dues can fill out this simple one-page form.

Teachers who want a rebate for the political portion of their dues can fill out this simple one-page form.

In recent years, CTA has designated about 65 percent of its dues to be “chargeable.”  If an agency fee payer disagrees with the unions’ stated breakdown between political and nonpolitical expenses, he or she can check a box on the above form to initiate an independent review of the union’s expenses.  The fee payer does not need to be present or provide evidence for that review, the costs of which are all borne by the union.

Friedrichs and Its Free Speech Arguments

The plaintiffs in Friedrichs seek to overturn Abood v. Detroit Board of Education, which in 1977 established that public sector unions could charge all employees for activities related to “collective bargaining, contract administration, and grievance adjustment purposes” – that is, that public sector unions could require employees to pay the chargeable portion of union dues.  The plaintiffs in Friedrichs prefer not only to make all union dues optional, but to change the default dues setting to “not contribute,” forcing members to take affirmative action to allocate any money at all to the union.

Building on Abood’s holding that public sector unions cannot compel employees to contribute to any “ideological cause,” the plaintiffs in Friedrichs assert that the distinction between collective bargaining activity and ideological lobbying activity undertaken by a public-sector union is a meaningless one.  They make four arguments in this vein:

1) They assert that “the broad fiscal impact of bargaining about wages and benefits makes it political speech about public affairs” (emphasis theirs). In other words, they note that public schools are funded by taxes, and that teacher compensation is a large part of what is covered by that funding.  Since the allocation of tax dollars is a matter of public importance and collective bargaining influences that allocation, they argue that collective bargaining must be considered political.

2) They contend that, because collective bargaining often pertains to matters debated in the education policy world, it is inherently political.

3) They argue that because the political activity of California’s teachers unions sometimes focuses on issues that are also collectively bargained (laws related to teacher employment, for example), it is absurd to argue that collective bargaining is somehow different from lobbying.

4) They assert that recent legal precedent suggests broad acknowledgment that the reasoning in Abood was incorrect, and that Harris v. Quinn in particular implies that the time is ripe for overturning Abood.

In the plaintiffs’ view, rules about inherently political activities like collective bargaining constitute a violation of employees’ free speech rights.

Part of this argument is bizarre on its face, as evidenced by the plaintiffs’ suggestion that union negotiations about class size and teacher employment protections are analogous to “threats to ‘blow off their front porches’ during a labor dispute or protest signs declaring that ‘God Hates Fags.’”  However, the plaintiffs are correct that recent legal precedent has significantly weakened Abood – given the makeup of the current Supreme Court (which is responsible for that precedent), it wasn’t a surprise that the Court decided to hear Friedrichs.

The plaintiffs also make a legitimate point about the fuzzy distinction between political and nonpolitical activity, but they ignore the fact that we draw seemingly arbitrary lines between the two all the time.  For example, many large corporations have lobbyists who fight against unions and labor standards, charitable arms that donate to organizations that undermine unions and labor standards, and managers who discourage unionization (both legally and illegally) at their stores – each of these activities is overlapping and affects the public interest, but only the first is typically classified as political.  Or consider the artificial division between the “news” and “editorial” teams at mainstream media outlets: “news” reports contain a plethora of implicit assumptions in them, but only editorials are technically considered political.

The activities classified as nonpolitical above can have a substantial fiscal impact; corporations that offer low wages and meager benefits increase the need for government support of low-income workers, for instance, and news articles exert a major influence on public policy debates.  For this reason, the plaintiffs’ arguments, if accepted, could potentially invalidate a whole lot of rules that differentiate political from nonpolitical activity.  It would simply be incorrect to suggest that Walmart and the Wall Street Journal engage in nonpolitical activities and unions don’t.

There is a legitimate question of where to draw the line between political and nonpolitical speech.  But even if there were a coherent argument about why public sector negotiations about working conditions should be considered more political than other forms of speech mentioned above (a condition that doesn’t appear to be satisfied), such an argument would still present an intractable problem: if accepted, it would likely restrict the ability of managers to discipline employees.  As Ian Millhiser explains at ThinkProgress, even Antonin Scalia foresees this potential problem (though that certainly doesn’t mean he’d be unwilling to rule against unions in Friedrichs) – if contributions to collective bargaining can violate an employee’s free speech rights, employer rules about the discussion of compensation packages and working conditions almost certainly can as well.

Fine – The “Political Speech” Argument Doesn’t Hold Water.  But Why Shouldn’t Nonmembers Be Allowed to Opt Out of Chargeable Spending?

The Supreme Court held in Abood that unions could collect an “agency fee” (the portion of dues that funds chargeable union spending) from nonmembers for two primary reasons:

1) The promotion of “labor peace:” The government has an interest, according to the Court’s opinion in Abood, in minimizing the potential for conflict between employees. The agency fee helps ensure that an employer will negotiate with one and only one bargaining unit, thus reducing the likelihood of employee disputes.

2) The prevention of “free rides:” Teachers unions cannot exclude nonmember teachers from the contracts they negotiate – all teachers, whether they are members or not, reap the benefits of the higher wages, better benefits, improved working conditions, and employee rights that unions secure. Without the agency fee, union members would be forced to subsidize the benefits of nonmembers.

The plaintiffs in Friedrichs contend that these reasons are not compelling.  They argue that, while labor peace concerns should prevent multiple, rival unions from co-existing, “the fact that public employers have an interest in dealing with one union rather than many…does not justify the additional and quite different proposition that the state can force all employees to support that one union [unless] ‘free riding’ would cause the extinction of the exclusive union” or if it would lead to a loss of benefits for the free-riding members.  Teachers unions, the plaintiffs argue, cannot (and have not even tried to) show that the invalidation of agency fees would weaken nonmembers’ benefits or threaten the unions’ existence.

The plaintiffs in Friedrichs also argue that it is the norm for advocacy groups to secure benefits for nonmembers – because “free riding” is allowed for doctors who don’t join the American Medical Association, they contend, it should be allowed for teachers as well.  They assert that whether or not coverage under union-negotiated contracts is even a benefit for nonmember teachers is debatable, as collectively-bargained contracts may include components (like the provision of retirement benefits or certain salary structures) with which nonmembers disagree.

Mainly because they believe labor peace and free rider concerns cannot justify what they term “compelled speech,” the plaintiffs in Friedrichs insist that “Public-Sector Collective Bargaining Would be Unconstitutional Even If It Were Not Core Political Speech.”

Yet there are several gaping holes in the plaintiffs’ arguments.   First, teachers unions could actually mount a clear and compelling case that the invalidation of agency fees would cause substantial harm to their operations.  Unions in states that have restricted collective bargaining are reeling; in Wisconsin, for example, where Governor Scott Walker initiated an anti-union crusade in 2011, compensation has fallen by 10 percent for members of the Wisconsin State Employees’ Union.  NEA membership in the state has fallen by a third and AFT membership by half.  Those are probably some of the reasons why both proponents and opponents of Friedrichs assert, in most articles written about the lawsuit, that it presents an existential threat to teachers unions.  To be fair, unions that step up their organizing efforts and effectively advertise how they benefit workers may be able to remain relevant even if the lawsuit proves successful (AFSCME, the SEIU, the NEA, and AFT are already focused on doing so), but a ruling in the plaintiffs’ favor would clearly make organizing significantly harder.

Second, the plaintiffs’ claim that union-negotiated contracts might harm rather than benefit some nonmembers is a red herring (and debatable, though let’s assume it’s true for the purposes of this argument).  While some nonmembers might think they could obtain more attractive compensation packages and better working conditions by negotiating independently with their school districts, members on the whole are definitively better off (in terms of compensation and working conditions) because of the union.  And there isn’t a multi-issue advocacy organization in the world, the American Medical Association included, in which every person covered under the group’s advocacy supports every action the group takes.

This claim also misses a key point about public goods: people must sometimes contribute to things they might not want because other people depend on their contributions.  To take the most obvious example, I support very little of our government’s defense spending, but I still have to pay the portion of my taxes that fund it.  Similarly, individuals who don’t want health insurance must still buy it, as taxpayers would otherwise be forced to subsidize their care. In both of these scenarios, as in the union case, allowing people the option to decline to fund part or all of the given service would make the whole system worse for those who depend on it.  Whether an individual wants everything in a collectively-provided service is less relevant than both whether that individual’s contribution is necessary for sustaining the service and whether the service is an important one to provide.

Nor are such mandated contributions limited to the public sector.  As Gordon Lafer explains, lawyers must pay mandatory fees to practice law and condominium owners are required to pay association fees.  Lafer also observes:

[E]mployer associations themselves refuse to live by the same rules they seek to impose on unions.

In Owensboro, Kentucky, the local Building Trades Council decided to withdraw its membership in the local Chamber of Commerce, but asked if it could still receive full member benefits even though it would no longer be paying dues. Absolutely not, answered the Chamber. “It would be against Chamber by-laws and policy to consider any organization or business a member without dues being paid. The vast majority of the Chamber’s annual revenues come from member dues, and it would be unfair to the other 850+ members to allow an organization not paying dues to be included in member benefits.”

Third, the whole idea that contributions to collective bargaining constitute “compelled speech” is preposterous.  While individuals who want to work as teachers in most traditional public schools today must pay the agency fee and accept the terms of their collectively-bargained contracts, individuals who want employment in any job must accept contracts that contain a variety of demands from their employers. Whether they’re negotiated by worker representatives or mandated by employers without union input, conditions of employment are conditions of employment.

Put differently, the plaintiffs are arguing that a school district can legally require its teachers, if they want to stay employed, to teach 35-student classes, to supervise events without pay after the school day is over, to attend meetings that they don’t think will help them improve their teaching, and to accept whatever salary the district is willing to offer.  But the same district cannot legally require its teachers to allocate a portion of their salaries to a group that negotiates those terms of employment on the teachers’ behalf.  According to the plaintiffs, employers can make employees follow rules unless one of those rules ensures that employees have a say over the rules they have to follow.  Such a position plainly has nothing to do with free speech and everything to do with views about who should have power in employer-employee relationships.

In short, requiring nonmember teachers to pay the agency fee is perfectly reasonable and similar to a range of practices in both the public and private sectors.  Teachers unions fulfill a variety of very important roles, many of which would be difficult to impossible to fulfill without the agency fee requirement.

Okay, Okay!  I Get That It’s Reasonable to Require the Agency Fee.  Can’t We At Least Change the Agency Fee Payer Process?

The plaintiffs in Friedrichs conclude by arguing that, at the very least, CTA’s requirement that dissenting teachers opt out of nonchargeable (political) dues each year is unconstitutional.  They assert that teachers should ideally have to opt in to nonchargeable dues and should definitely not have to renew their objections to such dues each year.

Enter Bain v. California.  The plaintiffs in Bain do not challenge the existence of the agency fee. They write: “The categorization of expenses as “chargeable” or “non-chargeable” is not at issue in this action. Plaintiffs do not object to paying the chargeable portion of dues as a condition of union membership.”  Instead, they contest the loss of union membership associated with opting out of nonchargeable dues.  The core argument from the Bain plaintiffs’ preliminary statement reads as follows:

9. Teachers who wish to remain members of their unions must contribute to both the unions’ “chargeable” and “non-chargeable” expenditures. In other words, every teacher who is a union member is forced to fund the unions’ political and ideological activities.

10. Resigning union membership has significant adverse consequences for a teacher. By becoming a non-member, a teacher is forced to give up important employment-related benefits that are available only to union members. For example, a non-member teacher is forced to forgo the ability to participate in the unions’ disability insurance program (including insurance that is necessary for full maternity-leave compensation), legal representation in cases of employment disputes, death and dismemberment compensation, and disaster relief, among many other benefits.

11. The teachers’ unions ensure that these employment-related benefits are available only to their members, and not to non-members, despite their obligation to negotiate equally on behalf of all teachers…Indeed, the unions use their exclusive bargaining status to ensure that these benefits are not provided by the employer, and therefore not available to non-members, so that teachers are deterred from (and penalized for) exercising their First Amendment right to opt out of contributing to the unions’ political and ideological expenditures.

12. In addition, by becoming a non-member, a teacher is forced to give up her ability to vote in elections that determine the union’s leadership and its collective bargaining position, and prevented from voting on employment-related matters, such as whether to adopt the collective bargaining agreement that determines the terms of teachers’ employment.

13. Because of these substantial employment-related benefits and voting rights that are available only to members, many teachers who do not wish to contribute to the unions’ political or ideological activities are effectively compelled to abandon their First Amendment rights and join (or remain members of) the unions. By punishing teachers for—and deterring teachers from—exercising their First Amendment rights, this arrangement violates the First Amendment.

14. Plaintiffs are public school teachers who wish to retain the employment- related benefits and voting rights that come with union membership, but also wish to exercise their First Amendment right to avoid contributing to the unions’ political or ideological activities. They seek the same right to opt out of funding the unions’ political and ideological activities that non-members have. They should not be forced to make the untenable choice of either (a) abandoning their First Amendment rights or (b) abandoning the employment-related benefits and voting rights the unions secure only for their members.

This argument would be pretty convincing if key parts of it weren’t misleading and/or untrue.

First, the Bain plaintiffs’ claims about benefits available exclusively to members are deceptive.  For example, they assert that “legal representation in cases of employment disputes” falls into this category.  While that’s technically correct – nonmembers do not have access to CTA lawyers – the plaintiffs fail to mention that union representation when a teacher has a grievance, which is sufficient in most cases, is provided to members and nonmembers alike.

Another example is maternity leave, which the plaintiffs in Friedrichs also mention.  Though CTA does not provide nonmembers with the same opportunity as members to purchase a specific disability insurance package that covers maternity leave, nonmembers have the opportunity to purchase very similar plans on the individual market.  Importantly, the complaints in both lawsuits omit the fact that the basic parental leave all employers in California (with 50 or more employees) are legally obligated to provide – up to twelve weeks of leave during which an employee still has health insurance coverage and a guaranteed job when she returns – are only available because of the federal Family and Medical Leave Act (FMLA) and the California Family Rights Act (CFRA), which unions were instrumental in helping to pass in 1993 (they also played a major role in securing California’s Family Temporary Disability Insurance program, which workers can use concurrently with the leave under FMLA and CFRA, in 2002).  In addition, some local teachers associations secure additional parental leave benefits, which go beyond those guaranteed by FMLA and CFRA, from their school districts.

In other words, the maternity leave “benefits” referenced by the plaintiffs are hardly benefits at all and are significantly less important than the benefits teachers unions are fighting to strengthen all the time.  The Bain plaintiffs’’ assertion that “unions use their exclusive bargaining status to ensure that [certain employment-related] benefits are not provided by the employer” is a blatant fabrication.

The deception here actually runs even deeper: while there’s no evidence that unions try to restrict benefits available to employees, the employers the Bain legal team typically represents do engage in that kind of behavior.  Lead attorney Theodore Boutros’s bio, for instance, proudly touts his role in helping to ensure that Walmart would not be held accountable for sex discrimination (resulting in lower pay and fewer promotions) against over 1.5 million women in 2011.  And the organization behind Friedrichs, the Center for Individual Rights, has strong ties to individuals and organizations, like the Koch Brothers and ALEC, that routinely put the kibosh on paid leave initiatives (not to mention workers’ abilities to secure a decent living).

The hypocrisy aside, the plaintiffs have their seemingly most legitimate argument when it comes to agency fee payers’ loss of voting rights – in some respects, there’s an important debate to be had about this practice.  Agency fee payers contribute to the unions’ collective bargaining activities, and since most union votes have a significant impact on collective bargaining, one could argue that agency fee payers deserve the right to vote in union elections.  Though letting agency fee payers vote might exacerbate the free rider problem, forcing teachers to choose between contributing to disliked political spending or losing the ability to vote seems unfair.

The problem with that formulation, however, is that it’s based on a false choice.  As explained earlier, teachers in districts represented by CTA can opt out of contributing to nonchargeable expenditures while remaining full-blown union members – with the right to vote and the ability to purchase CTA’s preferred disability insurance package – if they check a box on a simple one-page form.  Teachers who exercise this option will still pay full union dues, but all the money they contribute will go towards the unions’ chargeable expenditures, which the Bain plaintiffs (unlike the plaintiffs in Friedrichs) admit they aren’t contesting.

This option is actually a much better solution to the plaintiffs’ manufactured problem than is agency fee payer – it lets teachers opt out of contributions to nonchargeable expenses while simultaneously addressing the free rider concern.  Its very existence should nullify the lawsuit.  In fact, it’s probably a large part of why a judge dismissed Bain in September.  Unfortunately, however, the plaintiffs plan to continue pursuing the case.

What It Boils Down To

The fact that Friedrichs and Bain rely on a variety of misleading and/or dishonest claims illustrates what’s really driving these lawsuits. They aren’t about free speech or free choice and they’re not about constructing sensible policy.  Instead, they’re about undermining organized labor and further diminishing union strength and worker bargaining power.

For wealthy interests who benefit when workers lose and those congenitally opposed to teachers unions, these lawsuits are thus welcome.  But those who truly care about workers’ rights and are interested in the facts would do well to oppose both Friedrichs and Bain.

*Unions were also instrumental in

Note: A version of this post originally appeared in The Washington Post.

Update (12/5/15): This post was revised to note that unions also helped secure California’s Family Temporary Disability Insurance program in 2002.

2 Comments

Filed under Education, Labor

The Truth About School Funding

Dmitri Mehlhorn, co-founder of StudentsFirst, wrote an article a few weeks ago about school funding titled, “How Money is Spent Matters.”  That statement is obviously true; who could disagree with it?

Unfortunately, the article’s actual argument – that “America’s schools are not underfunded” – is completely false.  This post corrects the record.  Funding for public primary and secondary education in the United States is, in fact, inadequate and inequitable, and rectifying this problem should be a top priority for anyone who cares about improving our schools.

We’re Far From School Funding Equity

But what is adequate and equitable school funding?  Researchers Bruce Baker and Danielle Farie and civil rights lawyer David Sciarra, who produce a National Report Card on school funding fairness, discuss this question at length in their 2015 report.  One of the most important principles they note is that, because “[v]arying levels of funding are required to provide equal educational opportunities to children with different needs[,] finance systems should provide more funding to districts serving larger shares of students in poverty.”

School funding in the United States doesn’t come close to meeting this criterion; as Baker, Farie, and Sciarra show, fourteen states have regressive school funding systems, meaning they allocate less money to schools serving disadvantaged students than they do to schools serving more affluent student populations.  Nineteen other states have roughly equivalent funding between the two types of schools.  Only four states – Minnesota, Massachusetts, New Jersey, and Delaware – score high enough across all of the researchers’ criteria (funding level; funding distribution; effort, or funding as a share of the state’s economy; and coverage, or “the share of school-age children enrolled in public schools and the degree to which there is economic disparity between households in the public versus private education system”) to have their funding systems deemed “fair.”

This analysis likely represents an upper bound on the degree of school funding equity in the United States.  While California appears to have roughly equivalent funding for low- and high-income schools in the report, for example, there are major funding discrepancies between some of the state’s “basic aid” districts, which serve affluent students, and districts that serve lower-income populations.  Within-district variations in spending also go undetected in the report’s metrics, as may situations in which funding that is supposed to follow high-need students doesn’t reach them.

Inequitable school funding is a widely acknowledged problem, so much so that people associated with StudentsFirst – the very organization Mehlhorn co-founded – recognize that addressing it is imperative.  Yet Mehlhorn’s article doesn’t mention the distribution of school funding at all, except when making misleading statements about charter school spending.

Charter School Research Supports Calls for More School Funding

As Baker, Ken Libby, and Kathryn Wiley found in a careful 2012 analysis of charter school and traditional public school spending:

Comparative spending between the two sectors is mixed, with many high profile charter network schools outspending similar district schools in New York City and Texas, but other charter network schools spending less than similar district schools, particularly in Ohio.

Mehlhorn’s counterclaim that charter schools spend significantly less money than traditional public schools likely stems from a 2011 report from the National Center for Education Statistics, but it, like more cursory and flawed studies, may fail to appropriately categorize spending that should be assigned to each type of school.  Transportation funding and spending on food services and special education, for example, can be misclassified in such analyses.

In addition, students in traditional public schools perform just about as well on average as students in charters; as Harvard professor Tom Loveless has explained, the differences in student test score results between the two sectors “are extremely small, so tiny, in fact, that they lack real world significance.”  Mehlhorn’s inaccurate claims to the contrary rely on a completely invalid “months of learning” conversion performed in a recent study of urban charter schools; the study actually shows a tiny difference between the charter and traditional public school sectors (less than .06 standard deviations, or a good deal less than one additional question answered correctly on most tests).

In other words, there’s only one real conclusion that can be drawn about the research on overall levels of charter school funding and average student test scores: arguments touting charter schools as a low-cost solution to boost student achievement are either uninformed or deliberately misleading (especially because the student populations charters serve are typically unrepresentative subsets of the surrounding traditional public school populations, and because many studies don’t distinguish school effects from peer effects).

There is, of course, important variation in the charter sector; some studies indicate that students in some charter school networks do very well.  As Baker, Libby, and Wiley note, however, many of these networks spend substantially more per pupil (sometimes well over 30 percent more) than comparable public schools.  Similarly, the test score gains in New Orleans charters that Mehlhorn applauds came with a substantial price tag, a fact that his article conveniently omits.  The following excerpt from an interview with researcher Doug Harris is instructive on this point:

At the beginning New Orleans was spending about $8,000 more per pupil relative to similar districts. In other words, spending didn’t quite double, but it came pretty close to doubling in the initial years. And then it converged back to the normal, or close to normal rate. Now they’re spending about $1,000 more per pupil than similar districts, whereas before the storm they were spending close to the same as those comparison districts.

Harris doesn’t believe the test score gains in New Orleans were entirely a product of increased funding – he finds that explanation unlikely and thinks “every element of the reform package, including the change in spending, probably contributed in some fashion” – but acknowledges that it’s possible that increased funding played the primary role.  In addition, while Harris thinks there are important lessons to be learned from school reform there, he doubts “you’d see the same effects in other places because the conditions [in New Orleans] were distinctive.”

Either way, to the extent that best practices in certain successful charter schools drive their results, these practices can likely be replicated in traditional public schools that receive more adequate funding, as research by Roland Fryer suggests.  Especially because rapid charter school expansion has often led to harmful side-effects (in New Orleans, the large-scale firing of Black teachers and inattention to community preferences are poignant examples), our efforts are best focused not on promoting charters, but on adequately and equitably funding all schools, thus enabling them to implement best practices that may include but are not limited to better teacher training and support, more competitive teacher pay (to facilitate recruitment and retention), reduced class sizes, extended learning time, expanded tutoring availability, and enhanced extracurricular opportunities.

School Funding Research Confirms How Much Money Matters

There’s also a very strong research basis to support increased school funding – a research basis at least as strong as, if not stronger than, that behind practically any other education policy proposal.  Mehlhorn’s article elevates shaky empirical work from 25 years ago by Eric Hanushek (and work from nearly 50 years ago by James Coleman) to argue that money isn’t particularly important while downplaying the much larger body of more recent and careful research that comes to the opposite conclusion.

In 2012, Baker reviewed dozens of newer, higher-quality studies pertaining to this topic (Mehlhorn’s article mentions Baker’s review, but doesn’t link to it and paints an inaccurate picture of its findings).  As Baker’s review shows:

[T]here are a few things we can say with confidence about the relationship between funding, resources, and student outcomes:

First, on average, even in large-scale studies across multiple contexts, aggregate measures of per-pupil spending are positively associated with improved and/or higher student outcomes…

Second, schooling resources that cost money, including class size reductions and increased teacher compensation, are positively associated with student outcomes…Further, while there may exist alternative uses of financial resources that yield comparable or better returns in student outcomes, no clear evidence identifies what these alternatives might be…

Third, sustained improvements to the level and distribution of funding across local public school districts can lead to improvements in the level and distribution of student outcomes. While money alone may not be the answer, adequate and equitable distributions of financial inputs to schooling provide a necessary underlying condition for improving adequacy and equity of outcomes.

A new high-quality study by C. Kirabo Jackson, Rucker Johnson, and Claudia Persico comes to the same conclusion.  Mehlhorn’s article also mentions this study, but misinterprets the results; it mistakenly compares the invalid “months of learning” statistic from the charter school research discussed above (which actually represents data on student test scores) with Jackson et al.’s data on completed years of schooling.

In reality, Jackson et al.’s results are much more striking than most results in education research; the researchers argue in EducationNext that, “for low-income children, a 10 percent increase in per-pupil spending each year for all 12 years of public school is associated with roughly 0.5 additional years of completed education, 9.6 percent higher wages, and a 6.1-percentage-point reduction in the annual incidence of adult poverty.”  While they concede in a follow-up piece that increased school funding won’t “eliminate all differences in outcomes by socioeconomic status,” they contend “that a 22.7 percent spending increase is large enough to eliminate the average outcome differences between the poor (those with family incomes below twice the poverty line) and the non-poor (those with family incomes above twice the poverty line).”

The researchers’ claims here are overstated – they’re extrapolations beyond the actual results that, while less misleading than the “months of learning” statistic, are still misguided attempts to help a broader audience understand research findings – but it’s important to note that the magnitudes are very large relative to the results in most education studies.

It’s also worth noting that even Hanushek, who is one of the only researchers who continues to question the importance of school finance reforms, has never said that money never matters (Mehlhorn’s article gets that point right) and has admitted that schools serving more disadvantaged students should receive more funding.

We Can Afford to Spend More on Public Schools

Some skeptics of increased funding, Mehlhorn included, attempt to compare education spending in America with education spending in other countries.  Mehlhorn writes:

The best, though, imperfect way, to understand how well America is spending money on education is look at how much other nations – most-notably highly-touted Finland and South Korea — spend on their schools.

His article then proceeds to pull numbers from an OECD report to argue that Americans spend more on education than people in other countries, which, according to Mehlhorn, makes it “clear that money isn’t the main problem in American public education.”

The problem, however, is that the numbers in Mehlhorn’s piece are cherry-picked; they don’t actually speak to his argument about public K-12 education spending.  As the OECD report notes, the figures Mehlhorn cites include public and private spending on primary, secondary, and tertiary education – that is, college – including but not limited to spending on transportation, meals, school health services, college dormitories, and “private spending on books and other school materials or private tutoring.”

In general, the OECD data shouldn’t be used for cross-country comparisons; it doesn’t count spending the same way in each country and likely makes US spending appear larger relative to spending in other countries than it actually is.  To the extent that the data can be illustrative, however, the appropriate approach would exclude college costs and private spending and focus on K-12 public school spending as a share of the economy (as opposed to using raw numbers; spending as a share of GDP provides a better indication of how much a country spends relative to what it can afford).  Doing so (see Table B4.1 here) indicates that public spending on primary and secondary education in the United States, relative to GDP, is lower than spending as a share of the economy in Finland, the same as such spending in Korea, and slightly below the OECD average.  Again, the data is flawed, but it likely provides a high-end estimate of United States education spending relative to such spending elsewhere.

Mehlhorn’s article also paints an incomplete picture of historical levels of education funding in the United States.  The fact that K-12 spending has risen in inflation-adjusted dollar value terms over the past 45 years doesn’t tell us anything about whether school spending levels are sufficient, and real spending on practically everything has increased in dollar terms since the 1970s; in fact, real spending should increase as our economy grows.  A more appropriate (though still imperfect; one flaw is that it’s not adjusted for changing demographics) look at K-12 public education spending in the United States reveals that we are spending approximately the same amount relative to the size of our economy that we were several decades ago.

What’s more, K-12 education funding has declined significantly even in real dollar terms in recent years; during the 2014-2015 school year, 35 states were still providing less total state and local per pupil funding than they had been providing before the Great Recession.  Title I funding for low-income schools and special education funding have also fallen since 2010.

Finally, it’s important to remember that even if aggregate funding levels were higher, aggregate numbers don’t speak to the distribution of funding.  We’ve yet to target and sustain increased funding in schools that serve our neediest students.  Especially when it comes to low-income areas, America definitely can – and should – invest more in K-12 public education.

We Should Avoid False Choices and Invest in Kids’ Opportunities

Increased funding, to be useful, must of course be spent in smart ways.  Money by itself isn’t a panacea.  But it’s important to get the facts right: money matters, and it matters quite a bit.

It is incredibly counterproductive to pit increased funding and smart spending against each other (though Mehlhorn’s piece acknowledges “that money spent properly can be helpful in improving achievement,” it balks at the idea that schools need additional funding), especially when schools serving the most disadvantaged students tend to get the fewest resources.  Giving schools more money and making sure they spend that money wisely are complementary, not competing, goals.

Pitting education funding against social insurance and safety net spending, as former Tennessee education commissioner Kevin Huffman did in a recent article, is also absurd.  While it’s true that adequate income support and health care matter most for low-income students and that school-based reforms cannot, contrary to Huffman’s assertion, “be the lynchpin of social mobility in America,” schools are still very important.  Those truly committed to an equal opportunity agenda should stop taking potshots at its components and start getting to work on raising the revenues necessary to implement it.

As David Kirp wrote recently about pre-K programs: “Money doesn’t guarantee good outcomes, but it helps…In education, as in much of life, you get what you pay for.”

In America right now, we unfortunately don’t pay for the education system our students deserve.  Until we do, we won’t get it.

Update (11/5/15): Mehlhorn has written a new article that is supposed to be a response to this piece but that barely attempts to rebut any of the actual claims in it.  Instead, its argument is mostly that the factual errors and omissions that I discussed above are unimportant.

I’ve already explained why many of the article’s sections are misleading, particularly those about the school-funding and charter-school research (Mark Weber has also chimed in on charters), and I’m confident that the vast majority of education researchers (and others who have read the research in question) will agree that my summary is more accurate.

There are a couple topics that are worth slightly more discussion:

1) Mehlhorn devotes a lot of space to attacking Bruce Baker for editorializing. Baker certainly does have strong opinions, but I actually think it’s nice that he’s transparent about his perspective – all researchers have biases, and it’s in many ways preferable to know about them upfront.  Baker’s work is strong and consistent with other recent research.  The research Mehlhorn relies on – from Eric Hanushek, a member of the Right-wing Hoover Institution (note that Mehlhorn does not once mention Hanushek’s affiliation and biases) – is typically much older and a clear outlier (as I explained above).

2) David Dayen recently wrote an excellent piece about why citations of raw numbers for government spending – of the type that appear in Mehlhorn’s piece – are misleading.  I highly recommend it.  Mehlhorn is also mistaken about historical trends in real (inflation-adjusted) spending outside of education; as a quick look at the data for some of the categories he mentions (like certain technologies or defense) confirms, spending on (which is different than prices of things in) these categories has also grown over time (though by different amounts than education spending and not on a per capita basis for defense, which it would have been fine to point out).

One fair point Mehlhorn does make is that inflation-adjusted spending levels have value.  I used spending as a share of GDP above to note that the US spends less on education relative to what we can afford than many other countries and that our education spending relative to what we can afford hasn’t changed much over time.  Those facts in and of themselves don’t necessarily mean that our spending levels are insufficient; they just show that our investment in education is consistent with historical and international norms.  But while it’s fine for Mehlhorn to note that per-pupil spending in the US is up significantly in real terms since the 1970s, that also doesn’t necessarily tell us anything about whether spending levels are sufficient.  We may have been spending way too little in the 1970s, and we still may be spending way too little now.

In any case, Mehlhorn’s note that education spending has increased more than test scores doesn’t say anything, by itself, about the efficacy of that spending.  Student test scores are influenced more by outside-of-school factors than by school-based factors and it’s impossible to know how effective an intervention was without knowing what would have happened in the absence of the intervention.  Maybe test scores would have fallen if spending had remained flat.  We don’t know.  What we do know is that studies that attempt to identify a counterfactual, like Jackson et al.’s, indicate that increased school funding makes an important difference.

As I’ve repeatedly noted, money also has to be well spent.  But while increased funding for schools serving the neediest populations is not sufficient, it is necessary.

Update 2 (5/1/16): Mehlhorn wrote two additional pieces on this topic, one of which repeated most of the errors in his first “rebuttal” and the other which attacked Baker. He has insisted on Twitter that these pieces are fair.  In truth, anyone stumbling across them will be wildly misled.  After Mehlhorn commented on another blog post I wrote about a different topic, I made him an offer: I would catalogue exactly why I find his responses in this exchange to be disingenuous, and we would sit down and chat in person before he wrote anything else on the topic.  Mehlhorn agreed.

The piece linked below reviews in detail five areas in which Mehlhorn has continued to distort the facts and/or gotten them completely wrong.  There are reasonable disagreements to be had on school funding issues, but these aren’t some of them.

Mehlhorn’s mode of argument has often been to claim point X and cite “facts” A, B, and C to back X up.  When I show that A is wrong, B is misleading, and C provides incomplete information, Mehlhorn says, “X is still true.  So what if A, B, and C weren’t support for it; look at D and E.”  When I then show that D and E are misleading, Mehlhorn pivots to point Y and accuses me of disagreeing with Y throughout our earlier conversation.  I don’t think this approach constitutes good faith engagement.

I actually enjoy the discussions I’ve had with Mehlhorn in person thus far and hope that the conversation following this update goes well.  I also hope he will update his prior pieces with transparent corrections that note that the pieces were initially riddled with factual errors (knowledge about the evolution of articles is informative for readers).  It is perfectly fine for him to still disagree on certain points, and I would still be happy to consider any legitimate arguments he makes in the future (as I did in the update above).

Without further ado, here is the description of the errors he should correct.

Update 3 (5/3/16): Mehlhorn and I had a good conversation and he has posted a new piece that contains some clarifications of his positions.  I very much appreciate his engagement and his willingness to hash things out in person.  I also learned from the discussion myself.  Many of Mehlhorn’s conclusions are still off-base, I believe, and he hasn’t corrected all of his earlier errors yet, but since we’ve debated this issue at length already and he has made a good-faith effort, I’ll leave it here for now.

6 Comments

Filed under Education

A Closer Look at TFA’s Alumni Survey and Data Practices

Teach For America (TFA) recently released a report describing some of the results from its alumni survey.  The report provides interesting information about many alums’ careers.  At the same time, however, TFA’s misleading presentation of the results and the organization’s unwillingness to share the underlying data are troubling.

Consider the following three charts:

TFA Chart 1TFA Chart 2TFA Chart 3

The first of these charts claims to show “the mean value on the measure of total years teaching for each cohort,” the second ostensibly shows both the “mean and median total years teaching, by cohort,” and the third purports to show “the percentages of alumni in each Teach For America cohort that reported teaching 3 or 4, 5 or 6, or more than 7 years.”  A reader could easily think these statistics apply to everyone who joined Teach For America between 1990 and 2010.  But the charts depict statistics only for most TFA alumni who responded at some point to a TFA alumni survey; the two biggest categories of people they ignore are alumni who never responded to a survey and former corps members who did not complete their original two-year teaching commitments (while Raegen Miller and Rachel Perera, the authors of the brief, are clear that only alumni are their focus, the word “cohort” invokes images of all corps members that began teaching during a given year).  In other words, the charts depict results for an unrepresentative subset of the teachers who join Teach For America.

To their credit, Miller and Perera do discuss these issues in footnote 4:

The 23,653 alumni represented here represent about 85 percent of the alumni from the 1990 to 2010 cohorts. While alumni who don’t respond to the survey may be systematically different than those who do respond, the response rate is high enough to bolster the case that our statistics speak pretty well to the population of alumni. The alumni survey is administered only to those who complete their initial commitment to teach for two years. Alumni reporting fewer than two years of teaching on the survey, or more than the number of years possible since their corps year, were excluded from these analyses.

Still, most consumers of these misleading charts, especially when a chart is tweeted or included in a summary blog post, are unlikely to see footnote 4.  The footnote also doesn’t address the fact that TFA’s presentation of their survey results is in some cases downright untrue, as is the case in the following sentence from this TFA media piece: “Among more than 42,000 Teach For America alumni, some 84 percent report working in education or other capacities serving low-income communities.”

This statement is false because, as noted above, TFA does not have reports from the full population of “more than 42,000 Teach For America alumni” (TFA alumni may also incorrectly report that they work in “other capacities serving low-income communities” when they don’t in fact do so, but that’s a different conversation).

The charts below thus attempt to describe what the survey results actually tell us.

Revised TFA Chart 1

Revised TFA Chart 2

Because TFA won’t share their underlying data and declined to comment on this section of my post, the charts present a likely lower bound based on some simplifying assumptions I made: namely, that TFA has usable responses for at least 70 percent of alumni in each cohort (I’m told that response rates are typically lower in earlier cohorts), that fewer than 15 percent of corps members quit TFA before completing their second year of teaching, and that these corps members who quit average 0.75 years of teaching.

We cannot assert with confidence, as the report does, that “of those alumni from cohorts having had abundant opportunity to teach at least 5 years—say, those before 2001— approximately half have done so.”  Instead, with worst-case assumptions about alumni who didn’t take the survey, we know that at least between 34 and 39 percent of alumni from these cohorts taught for that amount of time.  If we include non-alumni in our calculations, as my revised charts show and seems appropriate, the lower bound drops even further (to a little less than one third of the teachers in each corps year).  It also appears to be possible that the majority of TFA corps members teach for two years or fewer.

That doesn’t mean these lower bounds are the actual percentages – in fact, I suspect that the true percentages, while likely lower than the report’s estimates, are closer to what Miller and Perera report than to the lower bounds.  Unresponsive alumni aren’t necessarily less inclined to continue or return to teaching than those who respond to surveys.  I also imagine that some corps members who leave before becoming alumni eventually return to the classroom through other channels.

Furthermore, even if the lower bound is closer to the truth, it’s clear that a good chunk of TFA alumni have extended teaching careers.  And while TFA’s attrition is greater than teacher attrition in general (which is still pretty high), critics sometimes forget that creating lifelong teachers is not TFA’s purpose.  A key part of TFA’s mission is to expose people interested in other careers to the obstacles facing low-income kids – to turn alumni who will go on to work in other fields into lifelong advocates for disadvantaged populations (this goal can backfire – prominent alumni too often undermine social justice efforts – but I believe it is an admirable goal).

The thing is, a thorough and honest look at TFA’s statistics isn’t damning.  The organization has many problems and needs to improve, but its teachers certainly aren’t harming students.  What is damning, however, is TFA’s lack of transparency.

When I requested information on the number of respondents from each cohort, the number of total alumni from each cohort, and the number of total corps members from each cohort – explaining that I wanted to conduct the exercise above – I had a good conversation with Miller that unfortunately culminated in the following response:

I’m afraid we won’t be posting the cohort-level n’s for the main analytic sample featured in Unsung Teaching. The brief does enough to defend the findings as is. In particular, the take-away points are broad ones, spanning many cohorts. And the footnotes document the rather conservative approach. Over 85 percent of alumni from the cohorts portrayed are represented in the analytic sample. At the cohort level, the percentages vary in a pretty predictable way, but none of them is small. Hard generalizations at the cohort level would be defensible, for the most part, but we didn’t go there. The little social media exchange has totally confounded the issue of response rate on the annual survey and the n’s you seek. The reason 85 percent of alumni (from cohorts 1990 to 2010) are involved is that some of the responses come from older surveys than the 2014 one. Using some dated responses improves the generalizability, but it does bias the statistics—downward. People can dispute the value of the work, but there’s not much of an argument to make with the n’s, at least about the brief. Thus, the decision not to share.

Miller makes some good points about the interpretation of the results.  The size of the sample – over 85 percent of total alumni from the studied cohorts – is impressively large.  Additionally, Miller is right to point out that the inclusion of older survey data could bias the results downwards (an alum who had taught for only two years when she filled out the 2010 survey, for example, might have taught more in the time since despite failing to fill out another survey).  But neither of these points provides a justification for declining my request.

The data I (and others, in the social media exchange I believe Miller was referencing) asked for should not be particularly difficult to provide.  Refusing to share it just doesn’t make sense if the data is legitimate – it serves only to make people wonder if TFA has something to hide.

On some level, TFA’s decision here is part of a broader pattern of data misrepresentation.  Many of my colleagues and I observed it on a small scale at TFA’s Institute in 2010 and it’s apparent on a larger scale when TFA propagates bogus statistics about corps members’ impact. Key TFA decision-makers still seem in too many cases to care more about promoting TFA as something that “works” than about honest and accurate assessment of evidence.

Since TFA proclaims that they “welcome independent research efforts to assess [their] impact and inform the continuous improvement of [their] program,” I find these actions to be pretty hypocritical.

Because the vast majority of the TFA staff I know (including Miller) care deeply about educational equity, I also find TFA’s organizational mindset baffling.  As I’ve written before, our students “depend on us to combat misleading claims by doing our due diligence, unveiling erroneous interpretations, and ensuring that sound data and accurate statistical analyses drive decision-making.”  TFA’s disinterest in data sharing does such analyses – and thus low-income students – a disservice.

The simplest fix to these problems is for TFA to appropriately caveat alumni survey results and, more generally, to improve the way they report statistics.  TFA could also use random sampling to obtain more representative data.  We used stratified random sampling for one of our member surveys when I was on the Executive Board of the San Jose Teachers Association (SJTA) and it paid major dividends; we could for the first time speak confidently about the generalizability of our results.

Interestingly, the results from SJTA’s random sample closely resembled the results from our pure volunteer survey.  The same could conceivably be true for the findings from Miller and Perera.  It’s just impossible to know without more research.

More importantly, TFA’s misleading data presentation and lack of transparency, combined with TFA’s silence in response to thoughtful critiques in other domains, make it difficult to trust the organization.  For an alum like me who deeply respects almost everyone on TFA staff I know and who thinks TFA could potentially be a strong ally in the fight for social justice, that’s a real shame.

3 Comments

Filed under Education

Is VAM a Sham? Depends on the Question You’re Asking.

  1. “Does data source X provide useful information?” and
  2. “Should data source X be used for purpose Y?”

are two very different questions.  Unfortunately, conflation of these questions by education researchers, writers, and advocates far too frequently results in bad policy recommendations.

This problem surfaces especially often in debates about value added modeling (VAM), a statistical method aimed at capturing a teacher’s effectiveness in the classroom.  Based on a new paper from economists Raj Chetty, John Friedman, and Jonah Rockoff, Andew Flowers writes, in response to question 1 above, that we’re pretty good at “the science of grading teachers” with VAM results.  Flowers weighs in on question 2 as well, arguing that Chetty et al.’s work means that “administrators can legitimately use value-added scores to hire, fire and otherwise evaluate teacher performance.”

In terms of question 1, the idea that VAM research indicates that we’re pretty good at “grading teachers” is itself debatable.  Flowers doesn’t conduct an extensive survey of researchers or research, but focuses on six well-known veterans of VAM debates, including several of the more outspoken defenders of the metric (Chetty and Thomas Kane specifically; Friedman, Rockoff, and Douglas Staiger are also longtime VAM supporters).  While many respected academics caution about VAM’s limitations and/or have more nuanced positions on its use, Jesse Rothstein is the only one Flowers cites.

In fact, whether VAM estimates are systematically biased (Rothstein’s argument) or not (Chetty et al.’s contention), there are legitimate questions about whether VAM results are valid (whether or not they are really capturing “teacher effectiveness” in the way that most people think about it).  VAM estimates correlate surprisingly little with other measures aimed at capturing effective teaching (like experts’ assessments of classroom instruction).  They’re also notoriously unstable, meaning that a teacher’s scores bounce around a lot depending on the year and test studied.  While other methods of evaluating teacher effectiveness have similar issues and there are certain approaches to VAM (not commonly used) that are more useful than others, it’s perfectly reasonable to argue that we’re still pretty bad at “grading teachers.”

More importantly, however, debates about bias, validity, and stability in VAM actually have much less to do with the answer to question 2 – should we use VAM to evaluate teachers in the way its proponents recommend? – than many people think.  To understand why, we need look no farther than two of the core purposes of teacher evaluation, purposes which everyone from teachers unions to education reform organizations generally agree about (at least rhetorically).

1) One core purpose of teacher evaluation is helping teachers improve. Making VAM results a defined percentage of a teacher’s evaluation is not useful for this purpose even if we assume VAM results are unbiased, valid, and stable.  Such a policy may actually undermine teacher improvement, and hence the quality of instruction that students receive.

For starters, a VAM score is opaque.  Teachers cannot match their VAM results back to specific questions on a test or use them to figure out what their students did or didn’t know.  VAM may be able to tell a teacher if her students did well or poorly on a specific test, but not why students did well or poorly.  In other words, a VAM score provides no actionable feedback. It does not indicate anything about what a teacher can do to help her students learn.

In addition, VAM results are outcomes over which a teacher has very limited control – research typically finds that teachers contribute to less than a fifth of the variation in student test scores (the rest is mostly random error and outside-of-school factors).  If a teacher’s VAM results look good, that might be because the teacher did something well, but it also might be because the teacher got lucky, or because some other factor contributed to her students’ success.  The tendency to view VAM results as indicative of whether or not a teacher did a good job – a common side effect of making VAM results a defined percentage of a teacher’s evaluation – is thus misguided (and a potential recipe for the reinforcement of unhelpful behaviors).  This concern is especially germane because VAM results are often viewed as “grades” by the teachers receiving them – even if they are only a small percentage of a teachers’ evaluation “score” – and thus threaten to overwhelm other, potentially productive elements of an evaluation conversation.

A better evaluation system would focus on actionable feedback about things over which a teacher has direct control.  Student performance should absolutely be included in the teacher evaluation process, but instead of making VAM a defined percentage of a teacher’s evaluation (part of a “grade”), evaluators should give teachers feedback on how well they use information about student performance to analyze their teaching practices and adapt their instruction accordingly.  This approach, unlike the approach favored by many VAM proponents, would help a teacher improve over time.

2) A second core purpose of teacher evaluation is to help evaluators make personnel decisions. Relative to the evaluation system described above – one that focuses on actions over which a teacher has control – making VAM results a defined percentage of teacher evaluations does not help us with this purpose, either.  Suppose a teacher gets a bad VAM result.  If that result is consistent with classroom observation data, the quality of assigned work, and various other elements of the teacher’s practice, an evaluator shouldn’t need it to conclude that the teacher is ineffective.

If there is a discrepancy between the VAM result and the other measures, on the other hand, there are a few possibilities.  The VAM results might have been unlucky.  The teaching practices the teacher employed might not be as useful as the teacher or evaluator thought they would be.  Or perhaps VAM isn’t a very good indicator of teacher quality (there’s also a possibility that the various other measures aren’t good indicators of teacher quality, but the measures suggested all have more face validity – meaning that they’re more intuitively likely to reflect relevant information – than do VAM results).  Under any of these alternative scenarios, using VAM results as a defined percentage of a teacher’s evaluation makes us more likely both to fire teachers who might actually be good at their jobs and to reward teachers who might not be.

When we evaluate schools on student outcomes, we reward (and punish) them for factors they don’t directly control. A more intelligent and fair approach would evaluate the actions schools take in pursuit of better student outcomes, not the outcomes themselves.

Relative to teacher evaluation systems that focus on things over which a teacher has direct control, using VAM results as a defined percentage of a teacher’s evaluation makes us more likely both to fire teachers who might actually be good at their jobs and to reward teachers who might not be.

To be fair, question 1 could have some relevance for this purpose of teacher evaluation; if VAM results were an excellent indicator of teaching quality (again, they aren’t, but let’s suspend disbelief for a moment), that would negate one of the concerns above and make us more confident in using VAM for reward and punishment.  Yet even in this case the defined-percentage approach would hold little if any advantage over the properly-designed evaluation system described above in helping administrators make personnel decisions, and it would be significantly more likely both to feel unfair to teachers and to result in a variety of negative consequences.

I’ve had many conversations with proponents of making VAM a defined percentage of teacher evaluations, and not a single one has been able to explain why their approach to VAM is better than an alternative approach that focuses on aspects of teaching practice – like creating a safe classroom environment, lesson planning, analyzing student data, and delivering high-quality instruction – over which teachers have more control.

So while the answer to question 1 in the case of VAM is that, despite its shortcomings, it may provide useful information, the answer to question 2 – should VAM results be used as a defined percentage of teacher evaluations? – is a resounding “no.”  And those who understand the crucial distinction between the two questions know that no amount of papers, articles, or researcher opinions, however interesting or useful for other purposes they may be, is ever going to change that fact.

8 Comments

Filed under Education