Teach For America (TFA) recently released a report describing some of the results from its alumni survey. The report provides interesting information about many alums’ careers. At the same time, however, TFA’s misleading presentation of the results and the organization’s unwillingness to share the underlying data are troubling.
Consider the following three charts:


The first of these charts claims to show “the mean value on the measure of total years teaching for each cohort,” the second ostensibly shows both the “mean and median total years teaching, by cohort,” and the third purports to show “the percentages of alumni in each Teach For America cohort that reported teaching 3 or 4, 5 or 6, or more than 7 years.” A reader could easily think these statistics apply to everyone who joined Teach For America between 1990 and 2010. But the charts depict statistics only for most TFA alumni who responded at some point to a TFA alumni survey; the two biggest categories of people they ignore are alumni who never responded to a survey and former corps members who did not complete their original two-year teaching commitments (while Raegen Miller and Rachel Perera, the authors of the brief, are clear that only alumni are their focus, the word “cohort” invokes images of all corps members that began teaching during a given year). In other words, the charts depict results for an unrepresentative subset of the teachers who join Teach For America.
To their credit, Miller and Perera do discuss these issues in footnote 4:
The 23,653 alumni represented here represent about 85 percent of the alumni from the 1990 to 2010 cohorts. While alumni who don’t respond to the survey may be systematically different than those who do respond, the response rate is high enough to bolster the case that our statistics speak pretty well to the population of alumni. The alumni survey is administered only to those who complete their initial commitment to teach for two years. Alumni reporting fewer than two years of teaching on the survey, or more than the number of years possible since their corps year, were excluded from these analyses.
Still, most consumers of these misleading charts, especially when a chart is tweeted or included in a summary blog post, are unlikely to see footnote 4. The footnote also doesn’t address the fact that TFA’s presentation of their survey results is in some cases downright untrue, as is the case in the following sentence from this TFA media piece: “Among more than 42,000 Teach For America alumni, some 84 percent report working in education or other capacities serving low-income communities.”
This statement is false because, as noted above, TFA does not have reports from the full population of “more than 42,000 Teach For America alumni” (TFA alumni may also incorrectly report that they work in “other capacities serving low-income communities” when they don’t in fact do so, but that’s a different conversation).
The charts below thus attempt to describe what the survey results actually tell us.
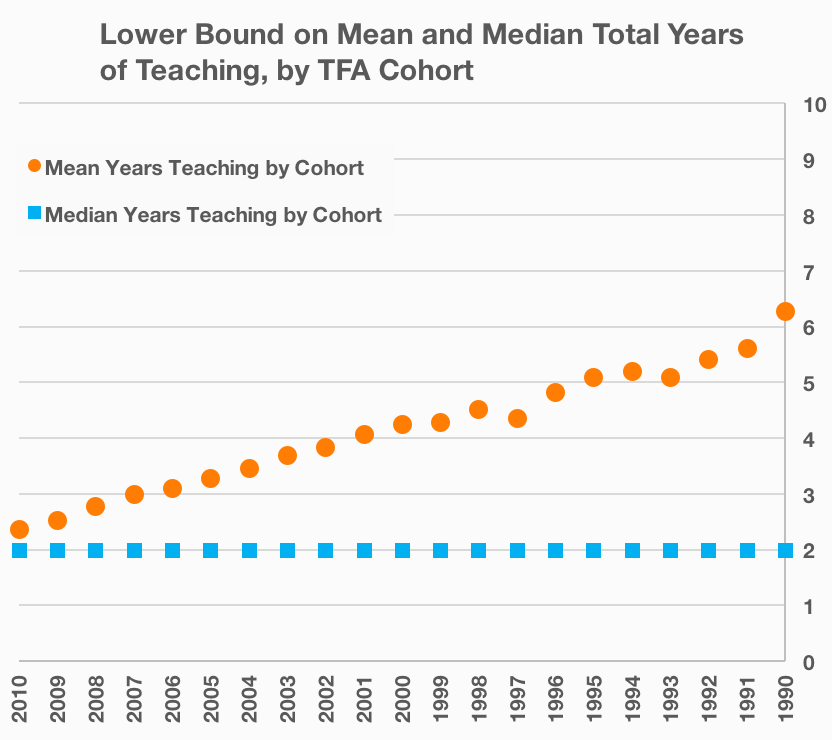

Because TFA won’t share their underlying data and declined to comment on this section of my post, the charts present a likely lower bound based on some simplifying assumptions I made: namely, that TFA has usable responses for at least 70 percent of alumni in each cohort (I’m told that response rates are typically lower in earlier cohorts), that fewer than 15 percent of corps members quit TFA before completing their second year of teaching, and that these corps members who quit average 0.75 years of teaching.
We cannot assert with confidence, as the report does, that “of those alumni from cohorts having had abundant opportunity to teach at least 5 years—say, those before 2001— approximately half have done so.” Instead, with worst-case assumptions about alumni who didn’t take the survey, we know that at least between 34 and 39 percent of alumni from these cohorts taught for that amount of time. If we include non-alumni in our calculations, as my revised charts show and seems appropriate, the lower bound drops even further (to a little less than one third of the teachers in each corps year). It also appears to be possible that the majority of TFA corps members teach for two years or fewer.
That doesn’t mean these lower bounds are the actual percentages – in fact, I suspect that the true percentages, while likely lower than the report’s estimates, are closer to what Miller and Perera report than to the lower bounds. Unresponsive alumni aren’t necessarily less inclined to continue or return to teaching than those who respond to surveys. I also imagine that some corps members who leave before becoming alumni eventually return to the classroom through other channels.
Furthermore, even if the lower bound is closer to the truth, it’s clear that a good chunk of TFA alumni have extended teaching careers. And while TFA’s attrition is greater than teacher attrition in general (which is still pretty high), critics sometimes forget that creating lifelong teachers is not TFA’s purpose. A key part of TFA’s mission is to expose people interested in other careers to the obstacles facing low-income kids – to turn alumni who will go on to work in other fields into lifelong advocates for disadvantaged populations (this goal can backfire – prominent alumni too often undermine social justice efforts – but I believe it is an admirable goal).
The thing is, a thorough and honest look at TFA’s statistics isn’t damning. The organization has many problems and needs to improve, but its teachers certainly aren’t harming students. What is damning, however, is TFA’s lack of transparency.
When I requested information on the number of respondents from each cohort, the number of total alumni from each cohort, and the number of total corps members from each cohort – explaining that I wanted to conduct the exercise above – I had a good conversation with Miller that unfortunately culminated in the following response:
I’m afraid we won’t be posting the cohort-level n’s for the main analytic sample featured in Unsung Teaching. The brief does enough to defend the findings as is. In particular, the take-away points are broad ones, spanning many cohorts. And the footnotes document the rather conservative approach. Over 85 percent of alumni from the cohorts portrayed are represented in the analytic sample. At the cohort level, the percentages vary in a pretty predictable way, but none of them is small. Hard generalizations at the cohort level would be defensible, for the most part, but we didn’t go there. The little social media exchange has totally confounded the issue of response rate on the annual survey and the n’s you seek. The reason 85 percent of alumni (from cohorts 1990 to 2010) are involved is that some of the responses come from older surveys than the 2014 one. Using some dated responses improves the generalizability, but it does bias the statistics—downward. People can dispute the value of the work, but there’s not much of an argument to make with the n’s, at least about the brief. Thus, the decision not to share.
Miller makes some good points about the interpretation of the results. The size of the sample – over 85 percent of total alumni from the studied cohorts – is impressively large. Additionally, Miller is right to point out that the inclusion of older survey data could bias the results downwards (an alum who had taught for only two years when she filled out the 2010 survey, for example, might have taught more in the time since despite failing to fill out another survey). But neither of these points provides a justification for declining my request.
The data I (and others, in the social media exchange I believe Miller was referencing) asked for should not be particularly difficult to provide. Refusing to share it just doesn’t make sense if the data is legitimate – it serves only to make people wonder if TFA has something to hide.
On some level, TFA’s decision here is part of a broader pattern of data misrepresentation. Many of my colleagues and I observed it on a small scale at TFA’s Institute in 2010 and it’s apparent on a larger scale when TFA propagates bogus statistics about corps members’ impact. Key TFA decision-makers still seem in too many cases to care more about promoting TFA as something that “works” than about honest and accurate assessment of evidence.
Since TFA proclaims that they “welcome independent research efforts to assess [their] impact and inform the continuous improvement of [their] program,” I find these actions to be pretty hypocritical.
Because the vast majority of the TFA staff I know (including Miller) care deeply about educational equity, I also find TFA’s organizational mindset baffling. As I’ve written before, our students “depend on us to combat misleading claims by doing our due diligence, unveiling erroneous interpretations, and ensuring that sound data and accurate statistical analyses drive decision-making.” TFA’s disinterest in data sharing does such analyses – and thus low-income students – a disservice.
The simplest fix to these problems is for TFA to appropriately caveat alumni survey results and, more generally, to improve the way they report statistics. TFA could also use random sampling to obtain more representative data. We used stratified random sampling for one of our member surveys when I was on the Executive Board of the San Jose Teachers Association (SJTA) and it paid major dividends; we could for the first time speak confidently about the generalizability of our results.
Interestingly, the results from SJTA’s random sample closely resembled the results from our pure volunteer survey. The same could conceivably be true for the findings from Miller and Perera. It’s just impossible to know without more research.
More importantly, TFA’s misleading data presentation and lack of transparency, combined with TFA’s silence in response to thoughtful critiques in other domains, make it difficult to trust the organization. For an alum like me who deeply respects almost everyone on TFA staff I know and who thinks TFA could potentially be a strong ally in the fight for social justice, that’s a real shame.

Leave a comment